Learning outcomes:
By the end of this activity you should know:
- the importance of UV measurements
- the measured UV quantities
- the units of UV exposure and how they are related
- the meaning and calculation of the UV index (UVI).
Human exposure to solar UV radiation depends on many factors including global solar UV levels. Monitoring solar UV radiation is, therefore, important to help people avoid overexposure to UV radiation and lower their risk of adverse health effects. In addition, measurements are required to study the effects of exposure to UV radiation and classify the environmental conditions that control solar UV radiation.
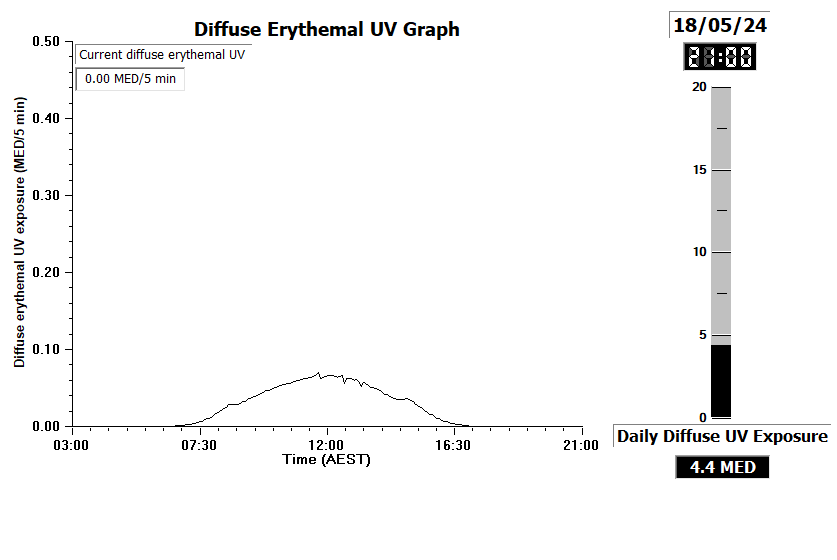
Several UV meters are installed on an unshaded roof of a building at the University of Southern Queensland. The meters measure the UVA exposure, total erythemal UV exposure and diffuse erythemal UV exposure over periods of five minutes. The UVA exposure is recorded in units of J/cm2 while the erythemal exposures are recorded in units of MED.

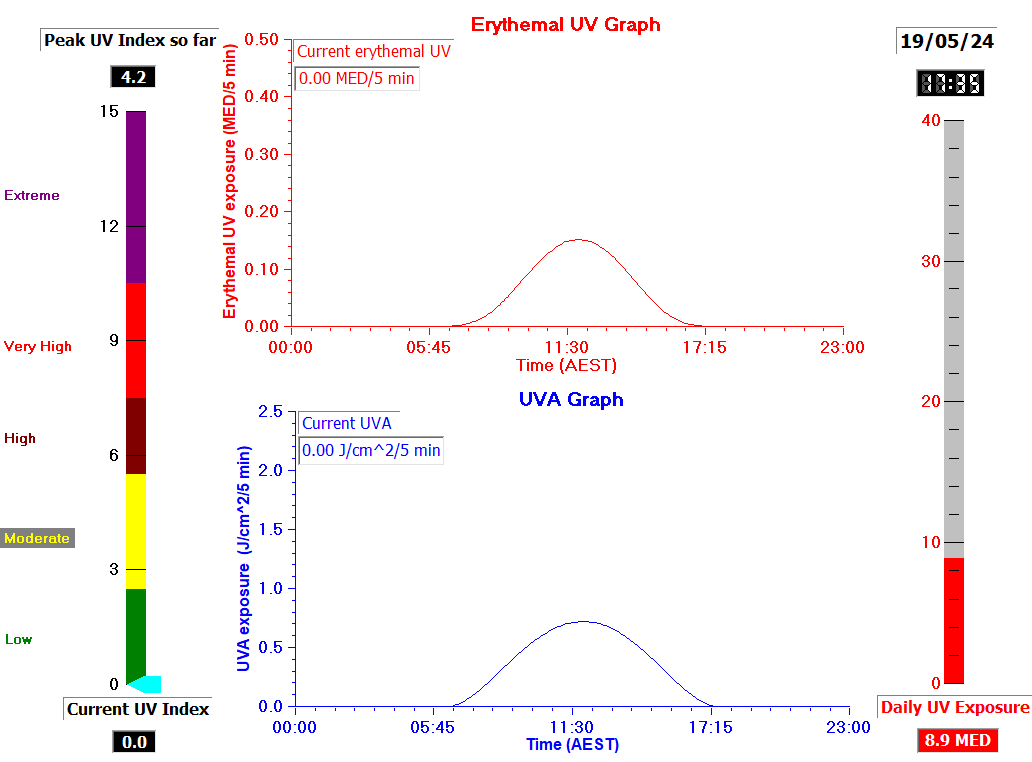
The raw data is stored in *.txt or *xlsx files for further processing and analysis. Examples of these files are: Total erythemal UV & UVA and Diffuse erythemal UV. In addition, the collected data is immediately processed to produce a gif file containing information about the daily erythemal UV and the UVA. The gif file is updated every five minutes and provided below. The gif file shows the following quantities:
- Current UV Index: An indicator shows the current value of the UV index. UV index is a unitless quantity that is obtained by multiplying the erythemal irradiance in units of W/m2 by 40. The graph of the UV index is divided into four coloured parts: green for low UV Index values (1-2), yellow for moderate UV Index values (3-5), brown for high UV Index values (6-7), red for very high UV Index values (8-10), and purple for extreme UV Index values (greater than 11).
- Peak UV Index: The maximum UV index recorded so far.
- Erythemal UV Graph: Shows the erythemal UV exposure in units of MED/ 5min, where 1 MED = 200 J/m2. The erythemal UV exposure is related to the erythemal irradiance by: erythemal exposure = erythemal irradiance [W/m2] × time [sec].
- UVA Graph : Shows the UVA exposure in units of J/cm2.
- Daily UV exposure: The cumulative erythemal UV exposure received to the current time in units of MED.


Latest weather observations for Toowoomba can be accessed from the BOM website.
Questions
- For any five minute period of erythemal UV exposure, calculate the exposure in units of J/m2. Find the average solar UV irradiance in W/m2 over those five minutes.
- Convert the calculated exposures in question 1 into a UV index.
- Starting from any optional time of the day, calculate the time taken for an exposure of one MED. Repeat this calculation for different parts of the day.
- Calculate the ratio of UVA to erythemal UV for different times during the day. At what part(s) of the day is the ratio higher? [Hint: make sure your ratios are converted to common exposure units of J/m2].
- Compare the daily erythemal UV graph of a cloudy day with the graph of a cloud-free day. What effect do the clouds have on the shape of the curve?
